




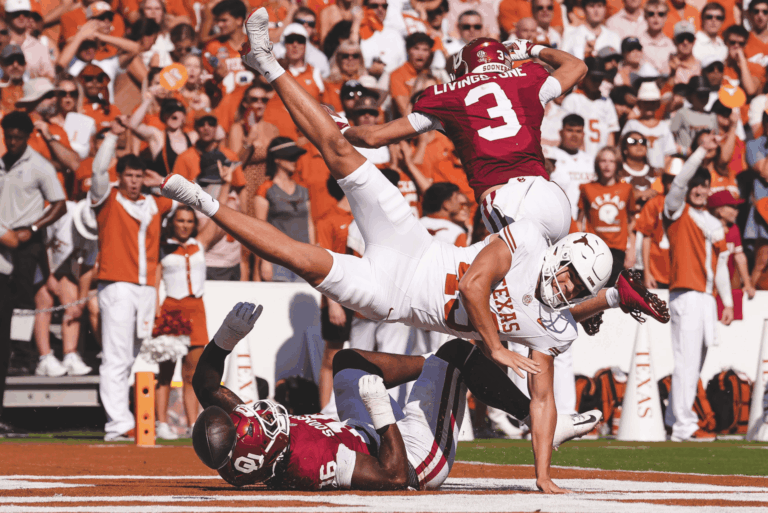
Texas vs. Oklahoma (2026)

Game Central 2026
#1Texas
4–1, 1–1
Final
24 – 27
Texas loses
Oklahoma
3–2, 1–1
Neutral site Saturday, October 10, 2026 · 2:30 PM CT · Cotton Bowl Stadium · Dallas, Texas · ABC

Line Score

Team 1 2 3 4 Final
Texas 7 10 0 7 24
Oklahoma 0 7 3 17 27

Texas vs. Oklahoma Recap

Arch Manning’s Costly Mistakes Doom No. 1 Texas in Stunning 27-24 Loss to Oklahoma

Arch Manning’s Costly Mistakes Doom No. 1 Texas in Stunning 27-24 Loss to Oklahoma

By Devon Messinger · Oct 10, 2026

Entering Saturday, there was little buzz surrounding the Longhorns in Dallas, Texas. Ranked No. 1 in the country, Texas appeared poised to head to the fairgrounds and take care of a 2-2 Oklahoma Sooners team that had just suffered an embarrassing loss to Georgia. However, the game quickly took a different turn. After a back-and-forth battle filled with self-inflicted wounds and momentum-shifting mistakes, Texas left the door open just long enough for Oklahoma to capitalize. Ultimately, the Sooners pulled off a game-winning field goal as time expired, sealing a stunning 27-24 victory.

Offensively, Steve Sarkisian’s squad struggled with consistency. Still, the Longhorns outgained Oklahoma by a wide margin, finishing with 382 total yards compared to the Sooners’ 238. However, those numbers tell only part of the story. Oklahoma’s defense and special teams made the difference, scoring two touchdowns. The first came on a blocked punt that the Sooners recovered and returned for a score.

Read the full story on HornSports →

By the Numbers

  • Tate Sandell's 47-yard field goal won it as time expired.
  • Oklahoma scored on a blocked punt return and an interception return.
  • Arch Manning threw for 260 yards and three touchdowns.
  • Texas leads the all-time series 65-52-5.

HornSports Coverage

Team Stats

TexasStatOklahoma
16 First downs 14
382 Total yards 238
63 Plays 57
6.1 Yards per play 4.2
122 Rushing yards 83
32–122 Rushes–yards 31–83
3.8 Yards per rush 2.7
260 Passing yards 155
19–31–2 Comp–att–int 18–26–0
8.4 Yards per pass 6.0
3–14 3rd-down conversions 2–13
1–1 4th-down conversions 0–0
2–2 Red zone (scores–trips) 1–1
2 Turnovers 0
0 Fumbles lost 0
3–19 Sacks–yards 2–10
8–61 Penalties–yards 7–62
8–36.5 Punts–average 9–41.6
29:29 Time of possession 30:31

Official numbers: Texas Athletics box score

Advanced Stats

TexasStatOklahoma
-0.08 EPA per play -0.02
+0.01 Rushing EPA per play -0.16
+0.18 Passing EPA per play +0.16
35% Success rate 34%
41% Standard downs success 44%
24% Passing downs success 6%
1.37 Explosiveness 0.81
Own 28 Average starting field position Own 26
4 Scoring opportunities 5
4.25 Points per opportunity 2.60
3.20 Line yards per rush 1.70
17% Stuff rate (lower is better) 35%

Postgame win expectancy: based on how each team played snap to snap, Oklahoma wins this game 65% of the time.

EPA (expected points added) measures how much each play changed a team's expected points. Success rate counts plays that gain 50% of the needed yards on first down, 70% on second and 100% on third or fourth. Explosiveness is the average EPA on successful plays. A scoring opportunity is a drive with a first down inside the opponent's 40. Stuff rate is the share of runs stopped at or behind the line. Highlighted numbers are the better side. Data: CollegeFootballData.com.

Top Performers

Texas

PassingArch Manning19/31, 260 yds, 3 TD, 2 INT
RushingDerrek Cooper8 car, 41 yds, 0 TD, long 16
ReceivingCam Coleman5 rec, 110 yds, 1 TD, long 42
TacklesRasheem Biles12 tot, 3 solo, 2 TFL

Oklahoma

PassingJohn Mateer18/26, 155 yds, 0 TD, 0 INT
RushingLloyd Avant10 car, 72 yds, 1 TD, long 42
ReceivingIsaiah Sategna III5 rec, 64 yds, 0 TD, long 20
TacklesOwen Heinecke9 tot, 2 solo, 2.5 TFL, 1 QH

Box Score

Passing

PlayerC/ATTYDSTDINT
Arch Manning19/3126032

Rushing

PlayerCARYDSAVGTDLONG
Derrek Cooper8415.1016
Hollywood Smothers12393.3014
Raleek Brown5224.407
Arch Manning7202.9012

Receiving

PlayerRECYDSAVGTDLONG
Cam Coleman511022.0142
Ryan Wingo25728.5134
Emmett Mosley V5438.6015
Hollywood Smothers2199.5016
Nick Townsend3186.009
Jermaine Bishop Jr.11515.0115
Raleek Brown1-2-2.000

Defense

PlayerTOTSOLOTFLSACKSPDQHFF
Rasheem Biles12320000
Jelani McDonald7300000
Maraad Watson5211000
Hero Kanu530.50000
Colin Simmons4332001
Derek Williams Jr.4210000
Justin Cryer4100000
Brad Spence3100000
Graceson Littleton3200100
Lance Jackson310.50110
Colton Vasek2110000
Emmett Mosley V0000100

Kicking

PlayerFGXPLONG
Gianni Spetic1/23/323

Leaders shown by category.

Full stats and play-by-play: Texas Athletics box score

Scoring Summary

  1. 1st Quarter
  2. TEXCam Coleman 41-yd pass from Arch Manning (Gianni Spetic kick)6:56 · 1 play, 41 yds, 0:087–0
  3. 2nd Quarter
  4. OUDakoda Fields 0-yd blocked punt return (Tate Sandell kick)14:11 · 3 plays, -6 yds, 2:157–7
  5. TEXRyan Wingo 34-yd pass from Arch Manning (Gianni Spetic kick)10:09 · 9 plays, 75 yds, 4:0214–7
  6. TEXGianni Spetic 23-yd field goal:12 · 10 plays, 60 yds, 3:3117–7
  7. 3rd Quarter
  8. OUTate Sandell 53-yd field goal10:56 · 7 plays, 52 yds, 2:3817–10
  9. 4th Quarter
  10. OULloyd Avant 2-yd run (Tate Sandell kick)14:48 · 6 plays, 47 yds, 4:0017–17
  11. OUPeyton Bowen 42-yd interception return (Tate Sandell kick)10:07 · 2 plays, -3 yds, 1:1517–24
  12. TEXJermaine Bishop Jr. 15-yd pass from Arch Manning (Gianni Spetic kick)6:32 · 7 plays, 75 yds, 3:3524–24
  13. OUTate Sandell 47-yd field goal:00 · 4 plays, 31 yds, 0:1924–27

Score shown Texas first.

Play-by-play: Texas Athletics box score

Welcome Back!

Login to your account below

Retrieve your password

Please enter your username or email address to reset your password.

2026 Texas 5–2 #19 AP
Full Schedule

Add New Playlist