Will Baizer
Staff Writer
- Joined
- Jul 24, 2015
- Messages
- 890
I charted every play the Texas Longhorns ran against Power 5 teams this year. I recorded down and distance, field position, types of pressure, types of throws and their results, individual performances after catch and after contact, and where the run plays are going through the offensive line.
Let's get started by looking at the how and why behind D'Onta Foreman's run dominance.
Per my count D'Onta Foreman has 1,613 yards on 241 carries. On these runs he has racked up 1,056 yards after contact and has caused 111 missed tackles. This means that 65% of his yards come after he has been hit the first time.
If you break down exactly where these yards are coming from on these runs, look no further than Beyoncé’s Irreplaceable.
YAFC = Yards After First Contact
FMT = Forced Missed Tackles (trucks and jukes)
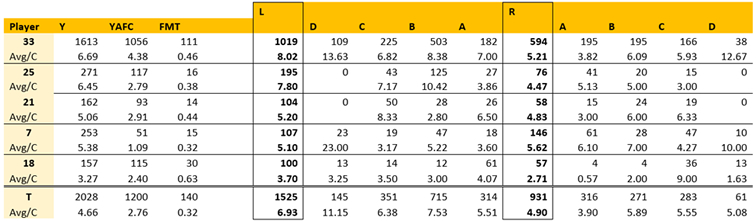
When D'Onta hits the left side of the line he has gained 1,019 of his 1,613 yards and averages 8.02 yards per carry - specifically the B and C holes. Lightly put, simply run anywhere around Connor Williams and Foreman is pretty much assured around 7 yards on average.
That doesn't mean the right side of the line is slacking, but Foreman makes them look a lot better. To prove this look at the same team where the other 2 backs combined received less than 30% of their yards, while Foreman has made a solid living on the right side with around 40% of his yards coming there.
However, the right side of the line is just poor, comparatively speaking. Despite them getting pretty similar run frequency (for D’Onta a 53/47 split, 54/46 split for rest of team), Texas has notched 1,525 yards on the left side and 931 on the right (a 75/25 split) and averages almost 7 yards per carry on the left and almost 5 on the right.
You can even take this a few layers deeper:
[*]Foreman has 5.58 yards after contact on average from the left and only 3.04 yards after contact on average from the right.
[*]Foreman has lost 1 fumble when running to the left and 4 when running on the right.
The Trek to 2000
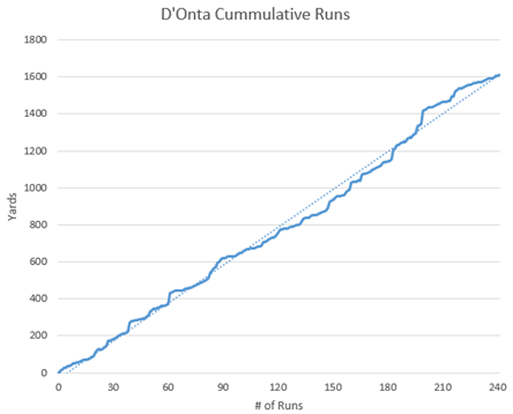
Above is a graph charting D’Onta’s progress this season. As you can see it is smooth. A clear progression minus a mid-season lull and a spike in the last 3 games.
D’Onta Foreman has hit his stride in the past month. To see that graphically we’ll break down his season into 3-game increments and the graph/trends look like this:
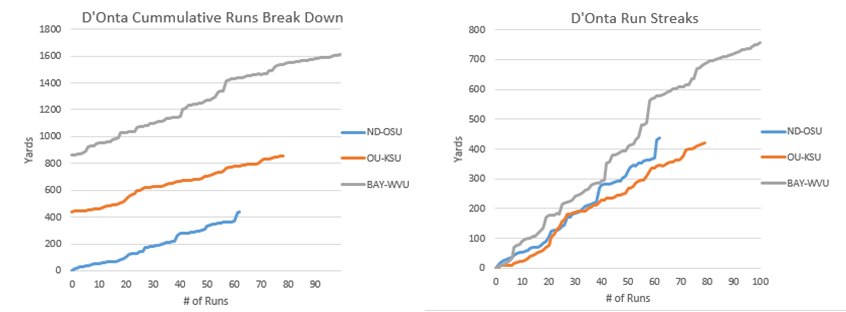
The longer the line, the more times he ran and the steeper the line the better those runs turned out.
If D’Onta Foreman stays on the same course he’s been on the past three games, he will need 47 carries to get the 387 yards he needs. However, he’ll be facing a Kansas team which is comparative to the Texas Tech defense he ran for over 300 yards on. I can see him breaking 2000 before the season is over.
A Note About the 18-Wheeler
To add fuel to the fire… Not only has Texas never passed out of the 18-Wheeler package, the package has only attacked 3 gaps a clear majority of the time: Left A, Right A, and Right D. Those three gaps accounted for 63% of Swoopes runs.
Looking at the 18-Wheeler package it seems to have finally been figured out around the 24th time it was deployed, which would be mid-way through the Oklahoma State game. Ever since then, the package has leveled off in productivity.
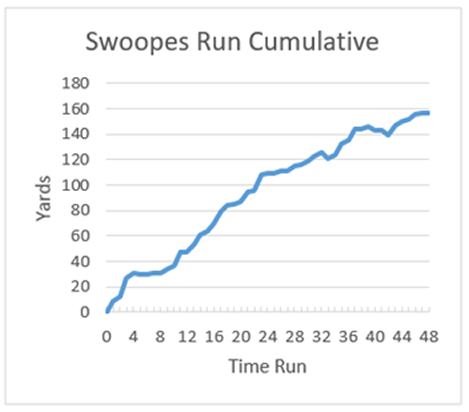
While Swoopes has only garnered 3.27 yards per carry due to predictable playing calling, he almost averages a truck, stiff-arm or straight-up juke on every single one of his runs and has gained 75% of his yards after contact. He has found the end zone 7 times. You want proof of Swoopes’s golden heart. Here it is. The scarecrow must be jealous.
In conclusion, D'Onta Foreman is a beast and so is Connor Williams. The coaches should figure out something that doesn’t involve Kent Perkins on the right side over the next few games….
In our next article, we will take a look at the passing game.
Let's get started by looking at the how and why behind D'Onta Foreman's run dominance.
Per my count D'Onta Foreman has 1,613 yards on 241 carries. On these runs he has racked up 1,056 yards after contact and has caused 111 missed tackles. This means that 65% of his yards come after he has been hit the first time.
If you break down exactly where these yards are coming from on these runs, look no further than Beyoncé’s Irreplaceable.
YAFC = Yards After First Contact
FMT = Forced Missed Tackles (trucks and jukes)
When D'Onta hits the left side of the line he has gained 1,019 of his 1,613 yards and averages 8.02 yards per carry - specifically the B and C holes. Lightly put, simply run anywhere around Connor Williams and Foreman is pretty much assured around 7 yards on average.
That doesn't mean the right side of the line is slacking, but Foreman makes them look a lot better. To prove this look at the same team where the other 2 backs combined received less than 30% of their yards, while Foreman has made a solid living on the right side with around 40% of his yards coming there.
However, the right side of the line is just poor, comparatively speaking. Despite them getting pretty similar run frequency (for D’Onta a 53/47 split, 54/46 split for rest of team), Texas has notched 1,525 yards on the left side and 931 on the right (a 75/25 split) and averages almost 7 yards per carry on the left and almost 5 on the right.
You can even take this a few layers deeper:
- Foreman has 9 touchdowns on the left and 3 on the right.The team has 15 touchdowns on the left and 7 on the right.
[*]Foreman has 5.58 yards after contact on average from the left and only 3.04 yards after contact on average from the right.
- The team averages 4.25 yards after contact from the left and 2.62 from the right
[*]Foreman has lost 1 fumble when running to the left and 4 when running on the right.
- ​The team has lost 2 fumbles when running to the left and 5 when running on the right.
The Trek to 2000
Above is a graph charting D’Onta’s progress this season. As you can see it is smooth. A clear progression minus a mid-season lull and a spike in the last 3 games.
D’Onta Foreman has hit his stride in the past month. To see that graphically we’ll break down his season into 3-game increments and the graph/trends look like this:
The longer the line, the more times he ran and the steeper the line the better those runs turned out.
If D’Onta Foreman stays on the same course he’s been on the past three games, he will need 47 carries to get the 387 yards he needs. However, he’ll be facing a Kansas team which is comparative to the Texas Tech defense he ran for over 300 yards on. I can see him breaking 2000 before the season is over.
A Note About the 18-Wheeler
To add fuel to the fire… Not only has Texas never passed out of the 18-Wheeler package, the package has only attacked 3 gaps a clear majority of the time: Left A, Right A, and Right D. Those three gaps accounted for 63% of Swoopes runs.
Looking at the 18-Wheeler package it seems to have finally been figured out around the 24th time it was deployed, which would be mid-way through the Oklahoma State game. Ever since then, the package has leveled off in productivity.
While Swoopes has only garnered 3.27 yards per carry due to predictable playing calling, he almost averages a truck, stiff-arm or straight-up juke on every single one of his runs and has gained 75% of his yards after contact. He has found the end zone 7 times. You want proof of Swoopes’s golden heart. Here it is. The scarecrow must be jealous.
In conclusion, D'Onta Foreman is a beast and so is Connor Williams. The coaches should figure out something that doesn’t involve Kent Perkins on the right side over the next few games….
In our next article, we will take a look at the passing game.